How Much It Costs to Live at Each MBTA Stop

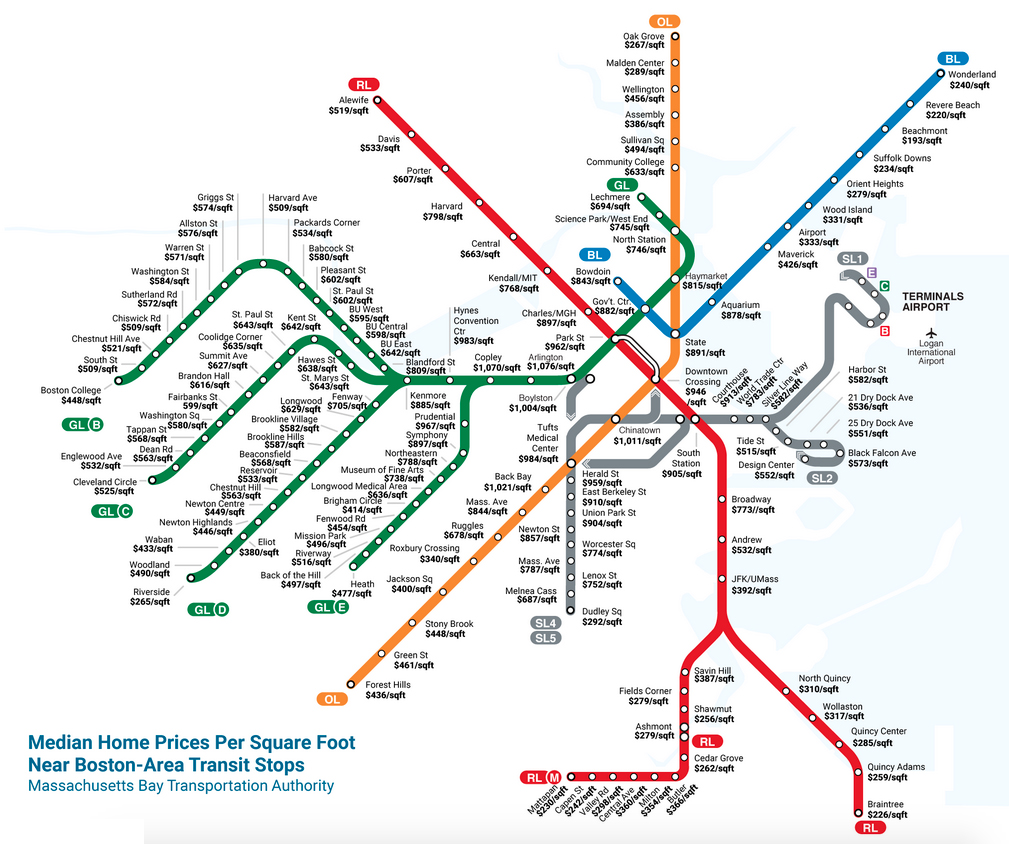
Image provided by Estately. Click here to see it larger.
Thinking of jumping lines? Whether your allegiance is to red, green, blue, orange, or silver, real estate search site Estately has put together a handy MBTA map of housing costs.
Broken down by prices per square foot, the map shows the average costs for houses, townhouses, and condos within a half-mile radius of each T stop.
As a whole, the Silver Line came out on top with the highest average price—$754. After that, three out of the four Green Line branches follow. The C Line is next at $708 per square foot, then the B Line at $673, and the D Line at $672.
The single most expensive T stop is Arlington at $1,076 per square foot. Next comes Copley, Back Bay, and Chinatown.
On the other hand, the least expensive spot is the Blue Line’s Beachmont stop at $193 per square foot (which is a $883 difference, for the record). After that, it’s Revere Beach and Braintree.
So, to summarize something you probably might’ve guessed sans map—the Orange, Green, and Silver Lines rack up significantly more dollar signs than Red and Blue.


