Here Are 2023 Boston Condo Prices by Neighborhood

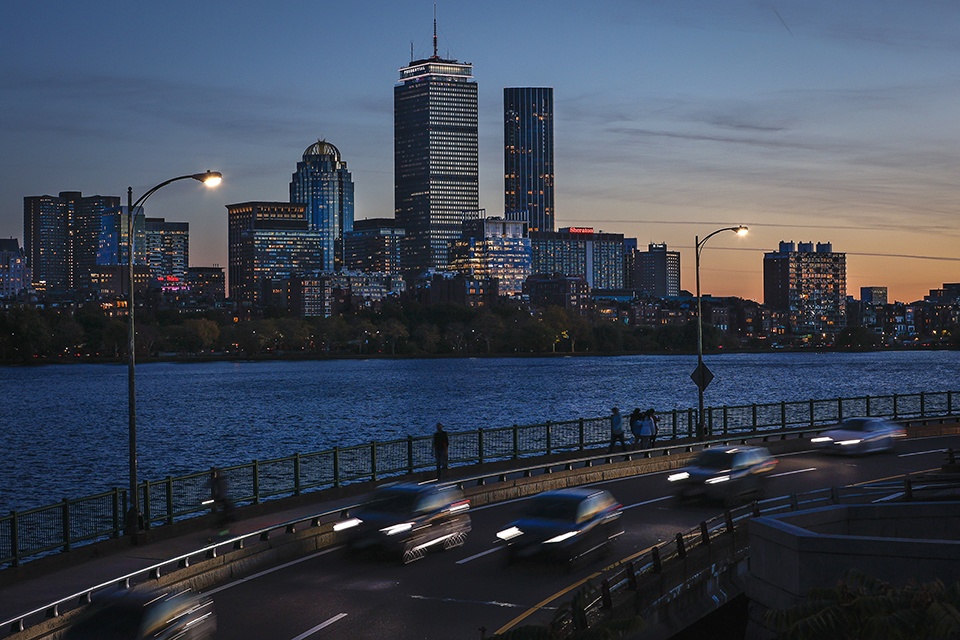
The Prudential Building, left, and One Dalton in the setting sun. / Photo by Erin Clark/The Boston Globe via Getty Images
Top Places to Live 2024
Where to Find a Deal in Greater Boston’s Sky-High Market
Greater Boston’s Single-Family Home Prices By Town in 2023
| Boston Neighborhood | 2023 Median Price | 2022 Median Price | 2018 Median Price | 2013 Median Price | One-Year % Change in Price | Five-Year % Change in Price | Ten-Year % Change in Price | 2023 Days on Market | 2022 Days on Market | One-Year Change of Days on Market | 2023 Number of Sales | 2022 Number of Sales | 2018 Number of Sales | 2013 Number of Sales | One-Year % Change in Number of Sales | Five-Year % Change in Number of Sales |
|---|---|---|---|---|---|---|---|---|---|---|---|---|---|---|---|---|
| Allston | $654,321 | $525,750 | $645,000 | $309,000 | 14% | -3% | -11.76% | 44 | 45 | -2% | 75 | 66 | 77 | 85 | 24% | 1% |
| Back Bay | $1,490,000 | $1,334,500 | $1,200,000 | $839,750 | 3% | -3% | -30.46% | 64 | 62 | 3% | 331 | 322 | 341 | 476 | 12% | 24% |
| Beacon Hill | $983,000 | $1,007,675 | $790,000 | $635,750 | -25% | -9% | -22.86% | 62 | 52 | 19% | 108 | 144 | 119 | 140 | -2% | 24% |
| Brighton | $713,537 | $520,000 | $520,000 | $305,250 | 60% | 6% | -2.33% | 33 | 51 | -35% | 293 | 183 | 277 | 300 | 37% | 37% |
| Charlestown | $876,250 | $842,000 | $727,750 | $510,000 | -34% | -42% | -57.99% | 35 | 31 | 13% | 134 | 204 | 232 | 319 | 4% | 20% |
| Dorchester | $586,275 | $559,500 | $485,500 | $295,000 | -31% | -39% | -20.86% | 41 | 40 | 3% | 148 | 216 | 242 | 187 | 5% | 21% |
| East Boston | $606,750 | $614,000 | $500,000 | $294,500 | -19% | -14% | 96.55% | 52 | 48 | 8% | 114 | 140 | 133 | 58 | -1% | 21% |
| Fenway | $706,000 | $577,500 | $650,000 | $385,000 | -23% | -32% | -47.46% | 40 | 43 | -7% | 62 | 81 | 91 | 118 | 22% | 9% |
| Hyde Park | $302,000 | $434,000 | $346,500 | $168,000 | -59% | -68% | -39.13% | 41 | 35 | 17% | 14 | 34 | 44 | 23 | -30% | -13% |
| Jamaica Plain | $675,000 | $705,000 | $620,000 | $375,000 | -21% | -25% | -32.63% | 40 | 29 | 38% | 287 | 363 | 381 | 426 | -4% | 9% |
| Leather District | $1,187,500 | $1,002,500 | $880,000 | $680,000 | -14% | 9% | -47.83% | 45 | 54 | -17% | 12 | 14 | 11 | 23 | 18% | 35% |
| Mattapan | $399,000 | $433,000 | $300,000 | $115,000 | -50% | -63% | -72.73% | 45 | 43 | 5% | 3 | 6 | 8 | 11 | -8% | 33% |
| North End | $680,000 | $697,500 | $597,000 | $455,000 | -30% | -39% | -47.87% | 49 | 50 | -2% | 49 | 70 | 80 | 94 | -3% | 14% |
| Roslindale | $583,750 | $610,000 | $489,375 | $302,250 | -20% | -19% | -8.33% | 31 | 26 | 19% | 132 | 164 | 162 | 144 | -4% | 19% |
| Roxbury | $517,000 | $490,000 | $451,000 | $248,000 | -77% | -70% | 20.00% | 74 | 63 | 17% | 12 | 52 | 40 | 10 | 6% | 15% |
| South Boston | $820,000 | $825,000 | $780,000 | $450,500 | -27% | -48% | -48.71% | 46 | 44 | 5% | 319 | 439 | 611 | 622 | -1% | 5% |
| South End | $1,212,500 | $1,049,000 | $995,000 | $650,000 | -27% | -20% | -35.16% | 44 | 40 | 10% | 378 | 517 | 471 | 583 | 16% | 22% |
| West End | $485,000 | $536,000 | $560,000 | $428,000 | -3% | 7% | -17.14% | 131 | 57 | 130% | 29 | 30 | 27 | 35 | -10% | -13% |
| West Roxbury | $600,000 | $543,000 | $391,500 | $265,000 | -11% | 13% | 0.00% | 36 | 27 | 33% | 85 | 96 | 75 | 85 | 10% | 53% |
Scroll right for additional data.
SOURCES: Boston neighborhood and town median home prices, sales volumes, and days on market provided by the Massachusetts Association of Realtors (marealtor.com) and MLS Property Information Network (mlspin.com).
First published in the print edition of the March 2024 issue, as part of our Top Places To Live 2024 cover package, with the headline, “The Big Real Estate Picture.”
