What Your Zip Code Says About You
via ESRI Tapestry Segmentation
Plenty of locals walk around thinking they know what types of people live in which neighborhoods, but those generalizations about Allston hipsters and tough Southie guys are often based on personal experiences and stereotypes, not fact.
That’s where websites like ESRI and Nielsen come in. These segmentation tools attempt to peg people’s personalities by assessing census data and other sources about the zip code they live in. By taking quantifiable values such as population, age, and income, ESRI’s Tapestry Segmentation and Nielsen PRIZM’s MyBestSegments spit out lifestyle categories that most of the population in a zip code fit into.
The best part: Even though the tools are most useful for marketers, anyone can go on these websites to explore zip codes around the country.
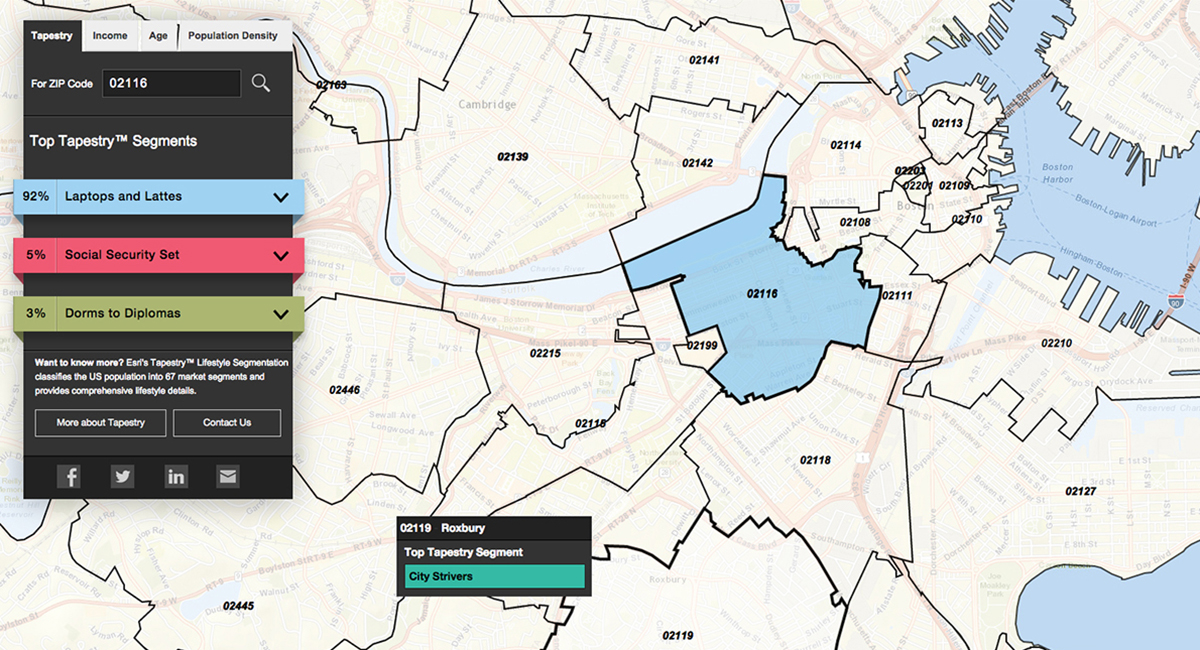
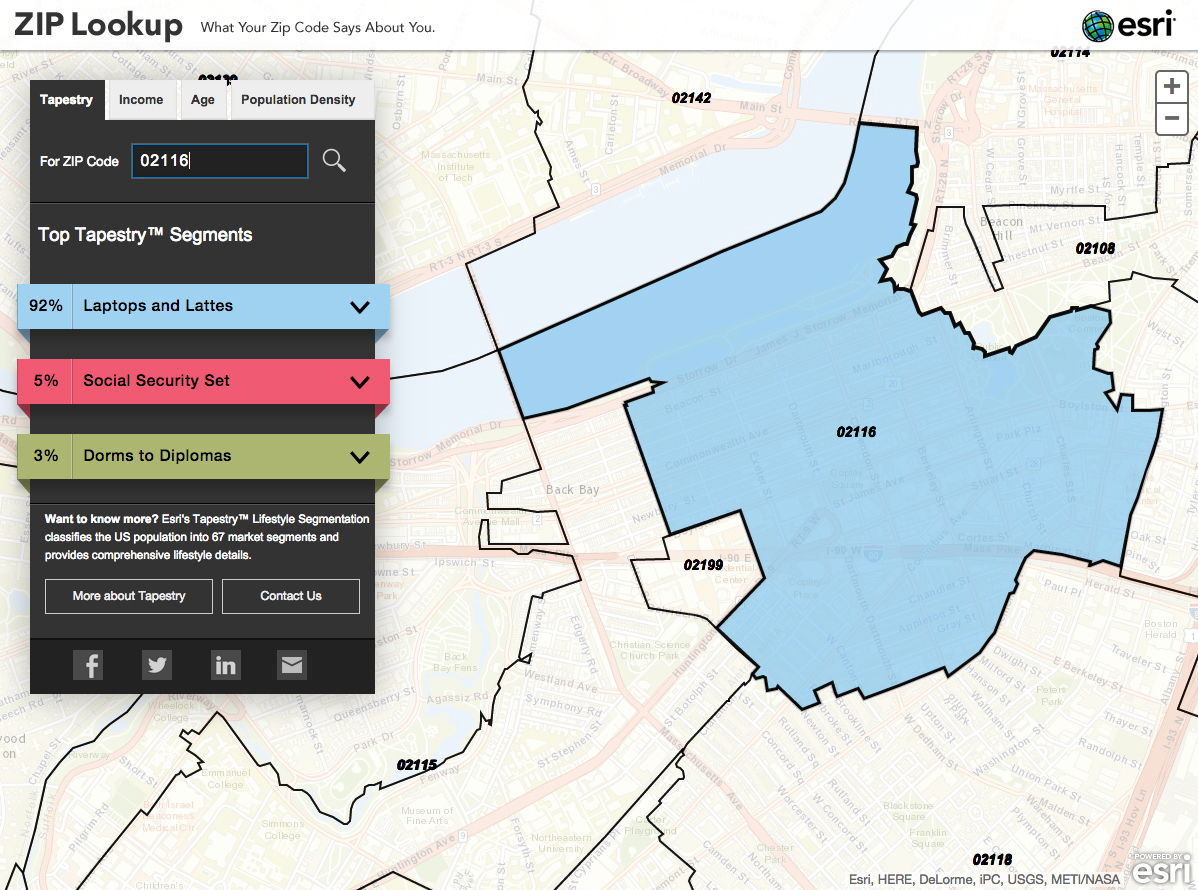
The recently updated ESRI Tapestry Segmentation categorizes populations into 67 different archetypes. For example, according to Tapestry, people who live in 02116, Back Bay, fit into these top three segments: 92 percent “Laptops and Lattes,” 5 percent “Social Security Set,” and 3 percent “Dorms to Diplomas.”
via ESRI Tapestry Segmentation
As expected, the city is full of “Metro Renters,” “City Strivers,” “Dorms to Diplomas,” and “Trendsetters.”
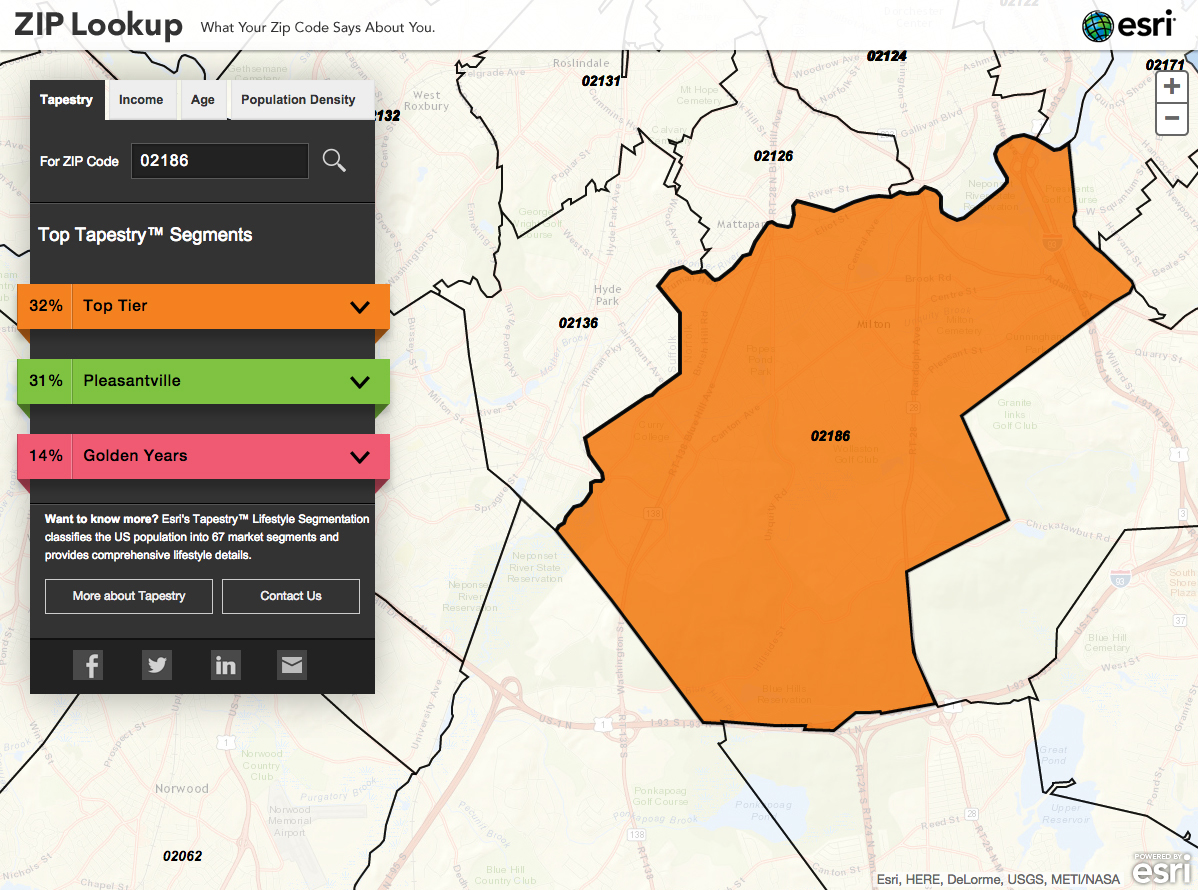
But move out to suburbs, and Tapestry will weave you a different picture. Milton, for instance, is 32 percent “Top Tier,” 31 percent “Pleasantville,” and 14 percent “Golden Years.”
via ESRI Tapestry Segmentation
Users can also click on the tabs in the gray box to see breakdowns in income, age, and population density. Click on the archetype names for a drop-down describing it in more detail.
Tapestry’s interface is fun to explore—users can easily click around the map to check out surrounding zip codes. You might stumble upon funny quirks like the Prudential Center, which has its own zip code—according to Tapestry, 02199 is 100 percent “Laptops and Lattes.”
Another tool worth checking out is Nielsen PRIZM’s MyBestSegments.
Unlike Tapestry, MyBestSegments has more amusing segment names. While Tapestry’s funniest title of all is “Soccer Moms,” MyBestSegments offers more creatively named categories like “American Dreams,” “Bohemian Mix,” and “Young Digerati.”
In addition to age, income, and population, MyBestSegments also offers pie charts of household composition and race and ethnicity.
Look at Dorchester’s 02125 zip code and you’ll find the category of “Multi-Culti Mosaic” listed in the top five segments for the neighborhood. The race-and-ethnicity pie chart will reflect that diversity.
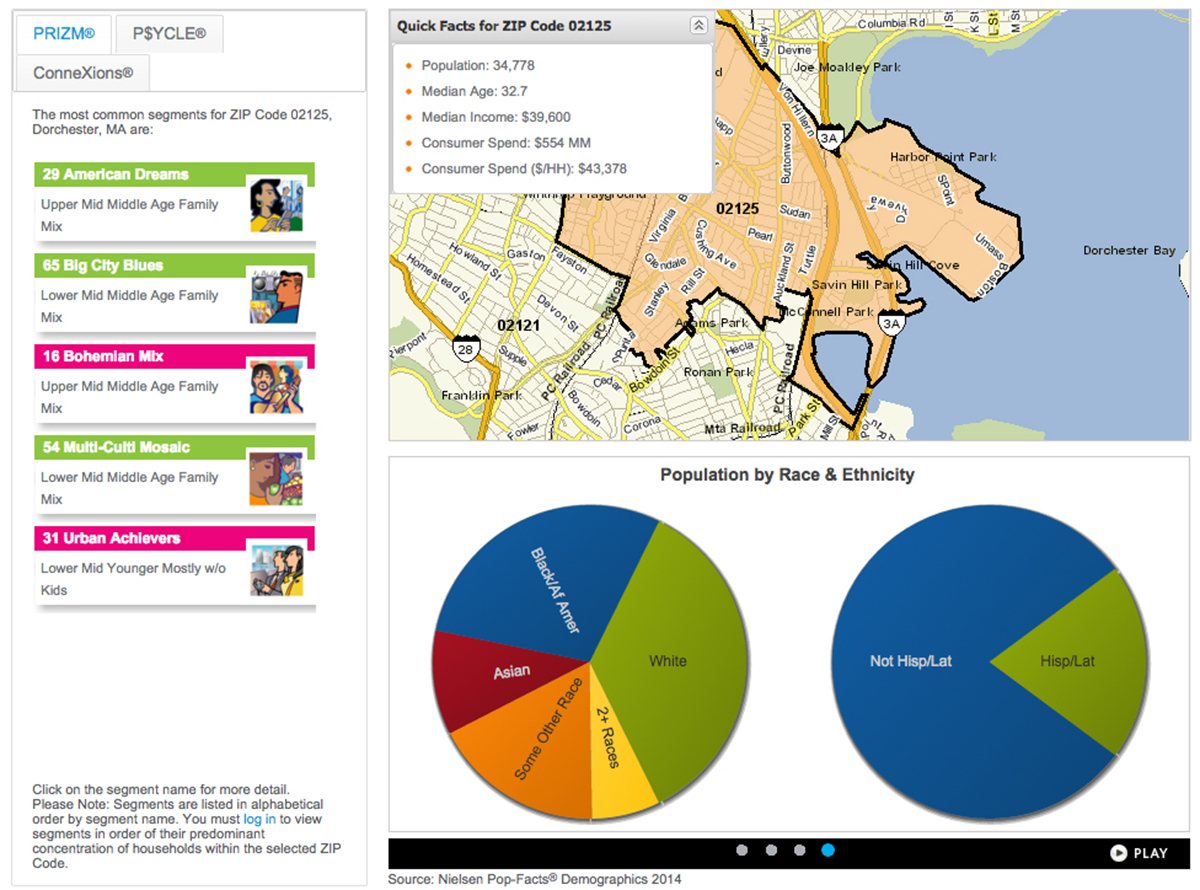
via Nielsen PRIZM’s MyBestSegment
Move out to Weston’s 02493 zip code and you’ll be surrounded by these top five segments: “Big Fish, Small Pond,” “Blue Blood Estates,” “Country Squires,” “God’s Country,” and “Upper Crust.”

via Nielsen PRIZM’s MyBestSegment
MyBestSegments is certainly clunkier to use than Tapestry—there’s no click-and-drag map functionality, and users have to enter a security code each time they want to look up a new zip code. However, the results are arguably more entertaining for casual visitors.
Whichever you prefer, both tools offer a data-based look at the neighborhoods we live and breathe in. Do they confirm your suspicions about where you live? Are you surprised by the characterizations? Have they pegged your personality? Where are you headed next?
Your move.