Maps: The Mayoral Election Results
You’ve probably read everything you need to know about Boston’s mayoral election, right? Wrong. Here, we follow up on our preliminary maps post with another set created by Andy Woodruff, a cartographer for Axis Maps and co-author of the Bostonography blog.
Based on data from the City of Boston Election Department, the following maps show a dot representing each vote recorded for the mayoral candidates in the general election, aggregated by precinct. The dots are distributed randomly within populated portions of each precinct based on the census, excluding unpopulated areas. Together, the maps give an overall picture of the geographic distribution of votes and voters in the election.
Votes for Walsh and Connolly:

Click to enlarge / All maps by Andy Woodruff for Boston Magazine
Voter Turnout:
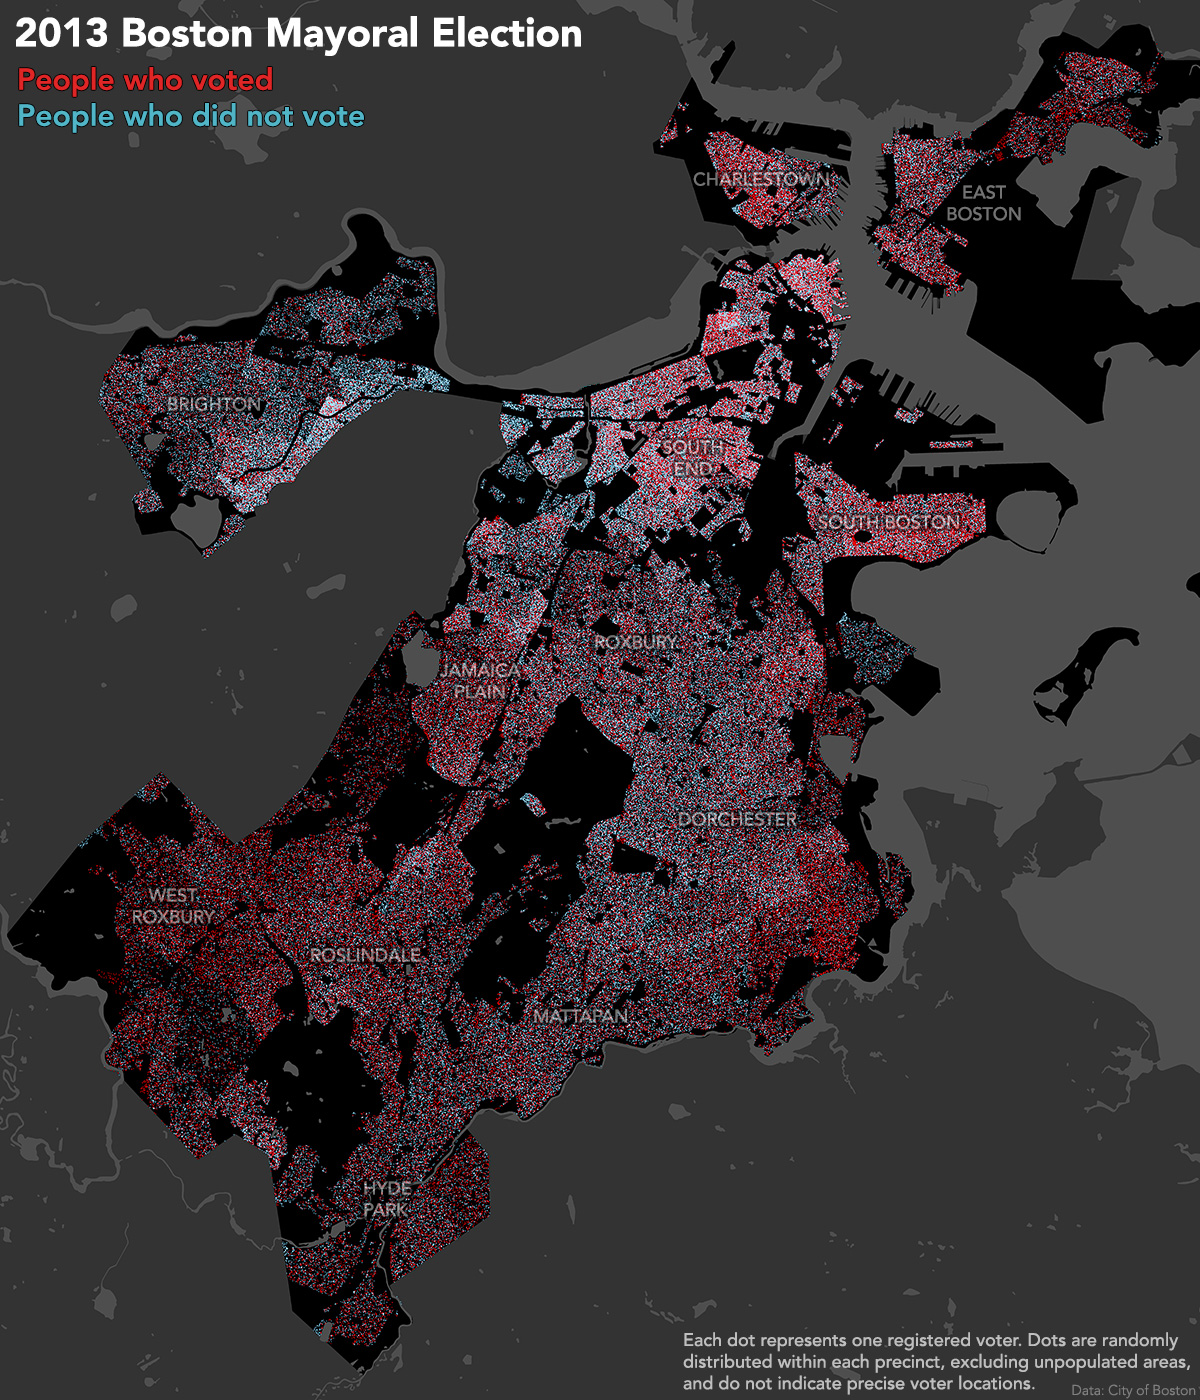
Click to enlarge / Map by Andy Woodruff for Boston Magazine
Walsh: Votes in Preliminary vs. General Election
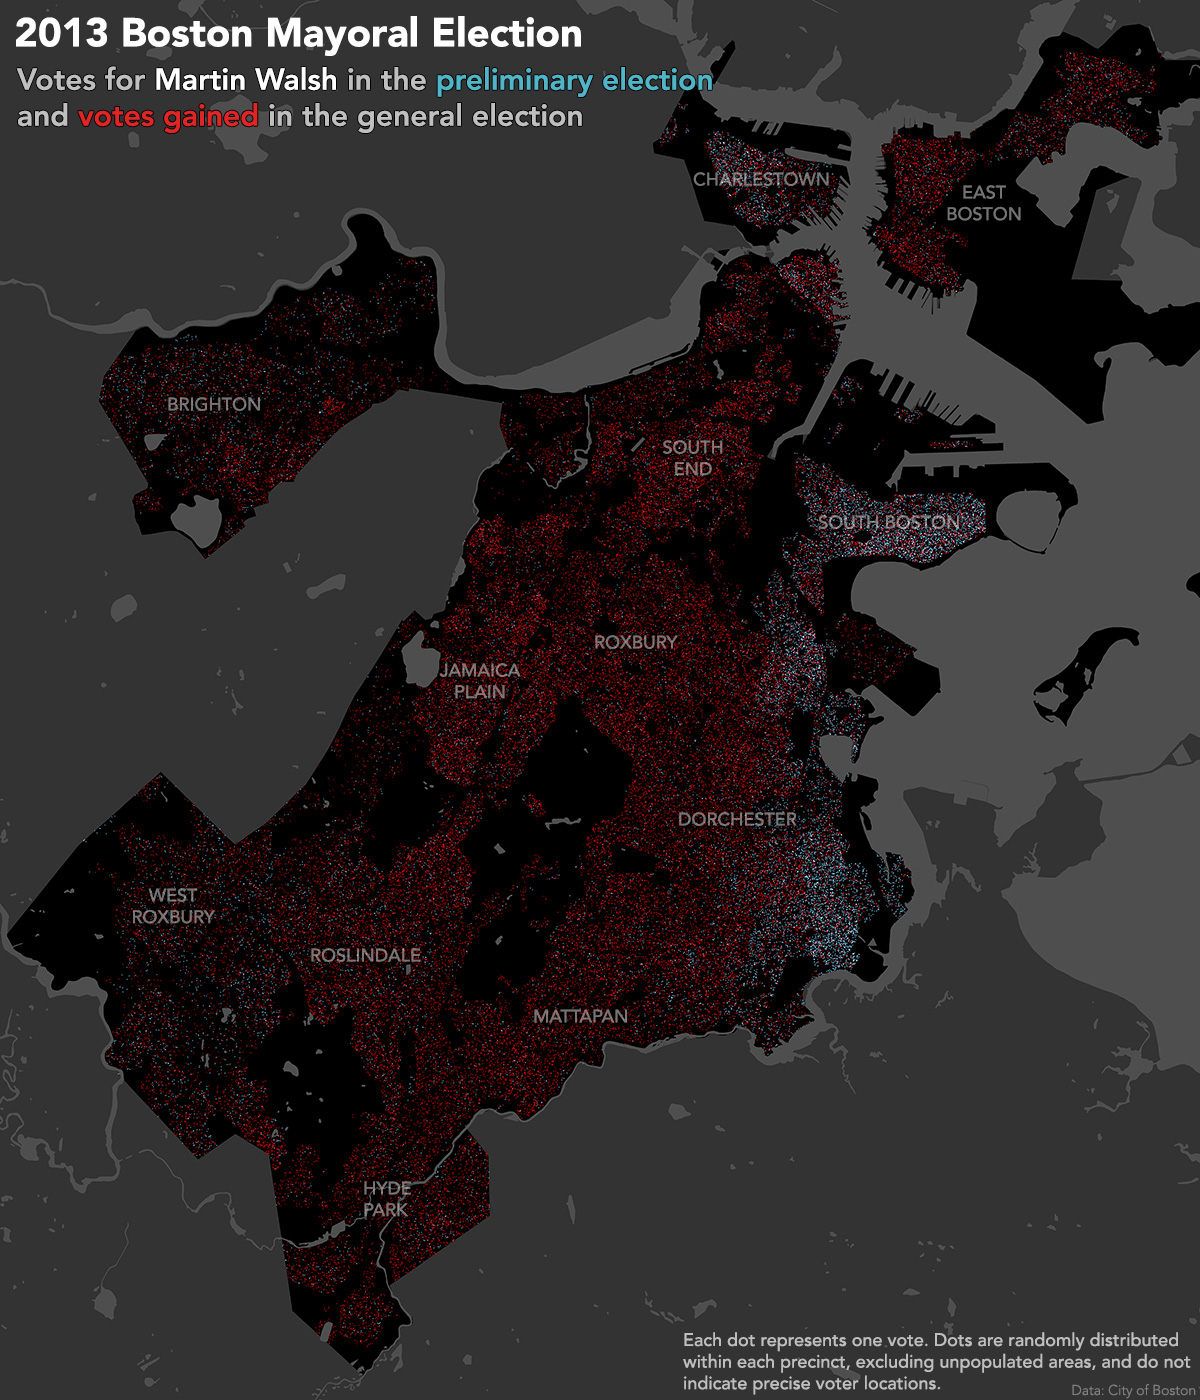
Click to enlarge / Map by Andy Woodruff for Boston Magazine
Connolly: Votes in Preliminary vs. General Election
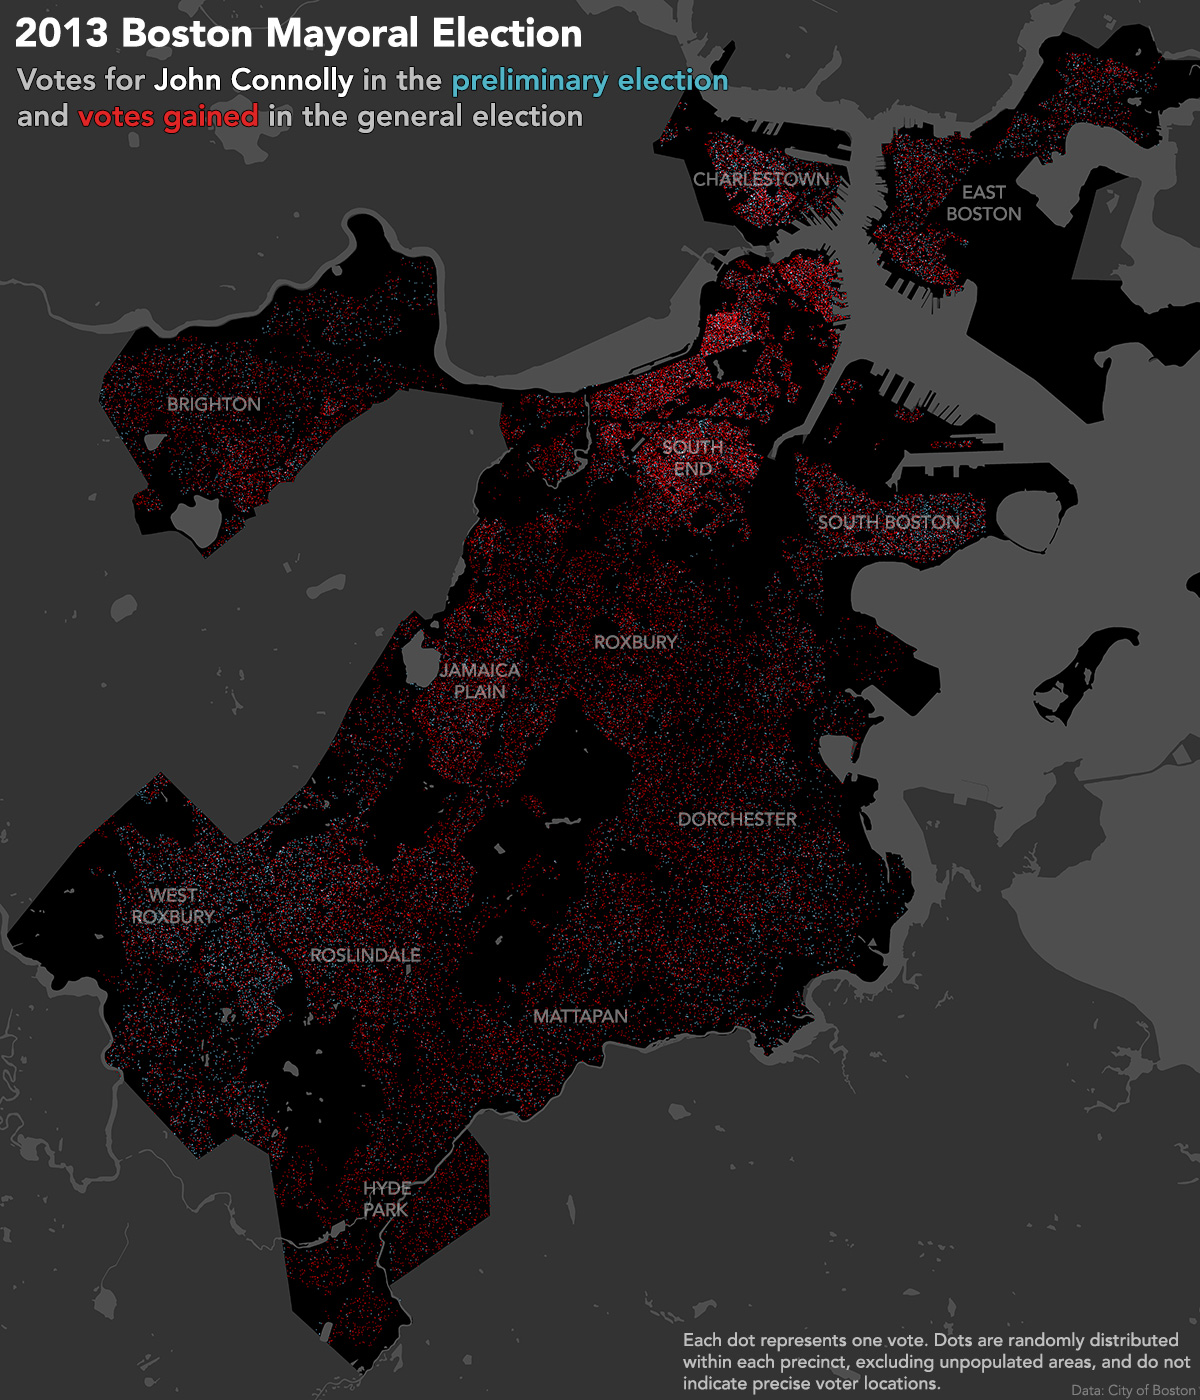
Click to enlarge / Map by Andy Woodruff for Boston Magazine