The Beautiful Chaos of Boston’s Fall Move-In, in One Heat Map
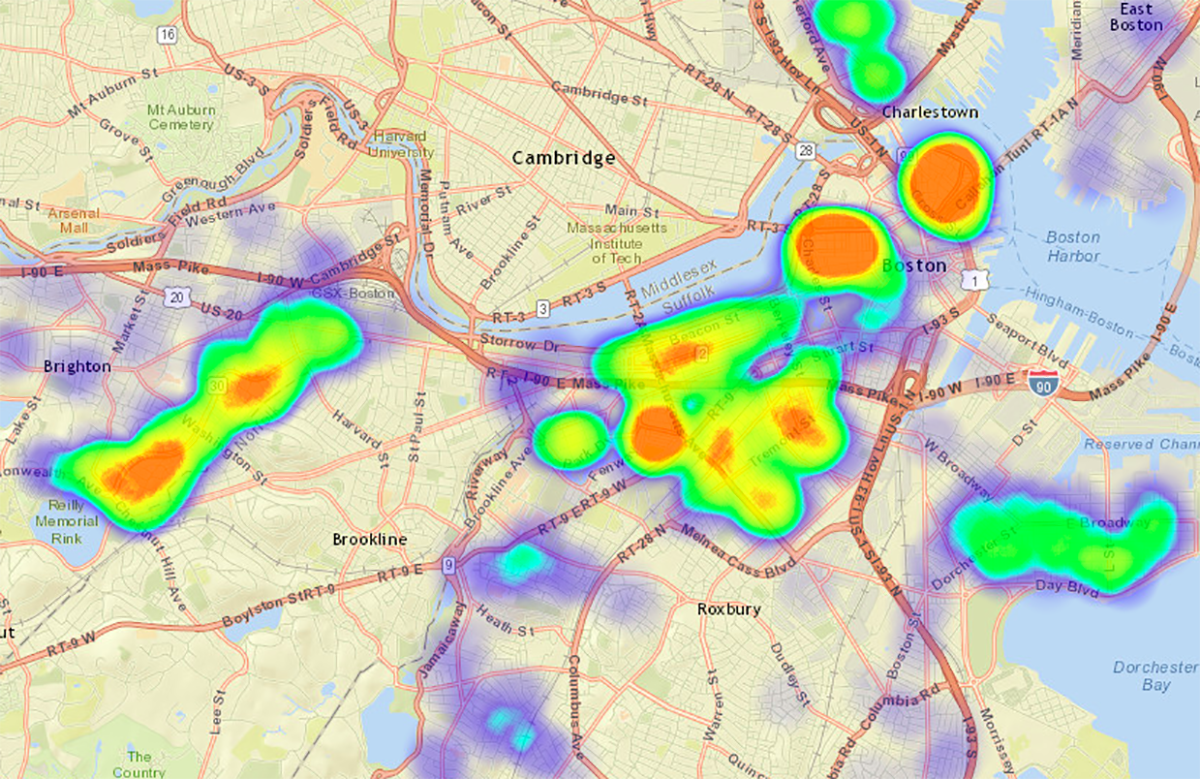
Image via City of Boston
Soon, Boston will once again be repopulated with wide-eyed youths wearing their dorm room keys on lanyards as they dart aimlessly in and out of traffic carrying Brita filters and desk lamps they’ll never use. Yes, late August and early September is a magical time for Boston, as the streets of Allston and Mission Hill overfloweth with couches and yellowed box springs, while countless moving trucks tempt fate on Storrow Drive as we intrepid content curators await the inevitable jack-knife.
Speaking of moving trucks, City Hall’s data on moving truck permits issued for August 28-September 3 is available to the public. Anyone occupying a public way in Boston must file for a street occupancy permit, allowing for the restriction of that area for a specified period of time. When the addresses on these permits are visualized on a heat map (with help from city’s principal data scientist, Curt Savoie), it immediately becomes clear which areas in Boston to avoid at all costs this weekend—or, if you’re among the glass half-full crowd, which areas to conduct your most spirited garbage-picking.
“I think it’s fantastic. The more the city could be doing with data, and the more we could facilitate with the moving process, the better,” Chief of Staff Dan Koh tells Boston magazine. “It’s stressful enough as it is, so the more we can facilitate it with technology, the better.”
To borrow a term from Boston 2024 and its Bid 2.0, the map shows several clusters of particularly high move-in activity. At first glance, you can easily spot Allston/Brookline, Fenway, Back Bay, Beacon Hill, and the North End, Sauron’s Eye of move-ins. The high concentrations in Beacon Hill and the North End aren’t all that surprising to Koh.
“Those tend to be pretty congested areas in general, and the streets are narrower, so it’s not particularly surprising to me,” he says. “But having that data is really fascinating.”