Boston’s Crazy Fall Move-In, in One Heat Map
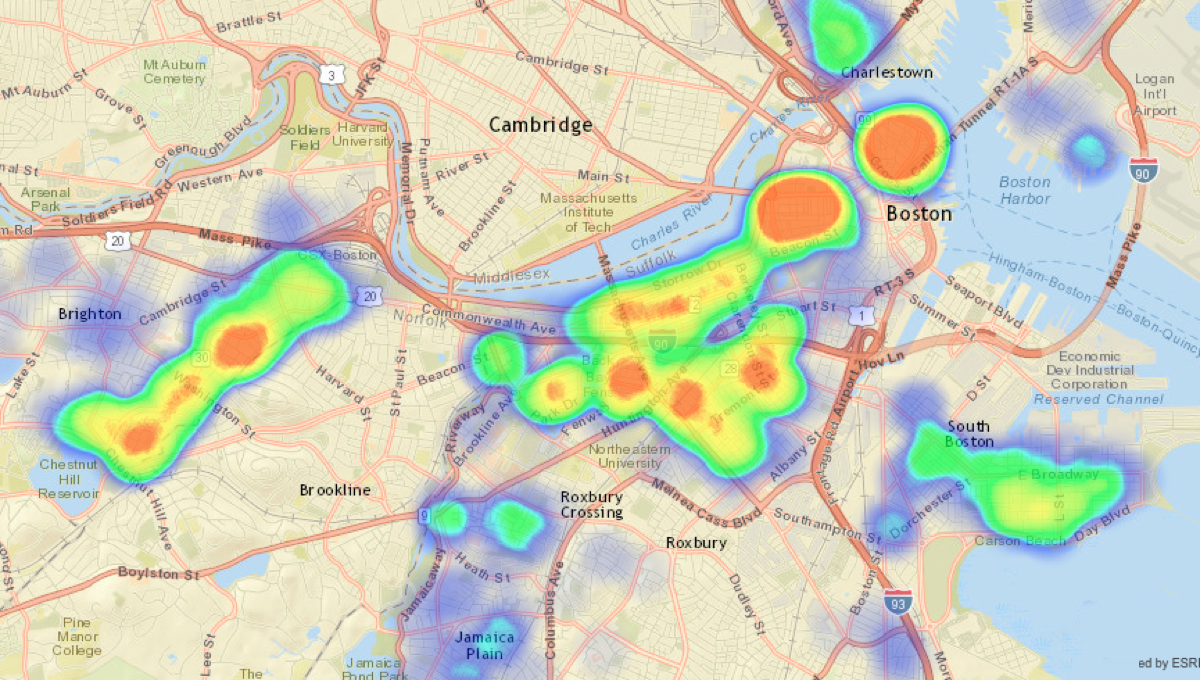
Image via City of Boston
There’s an autumnal chill creeping in. Soon, it will be time to trade in your cargo shorts for a pair of tasteful slacks and embrace all things pumpkin spice: beer, coffee, Oreos, think-pieces—you name it.
Fall also means hordes of students will be flocking back to Boston’s countless colleges and universities, clogging the T and engaging in the time-honored tradition of testing the infrastructure along Storrow Drive.
City Hall’s data on moving truck permits issued for August 23 through September 6 is available to the public. Anyone occupying a public way in Boston must file for a street occupancy permit, allowing for the restriction of that area for a specified period of time. When the addresses listed on these moving permits are visualized on a heat map, we can see which areas will see the most commotion during this year’s fall move-in.
The crowded, narrow streets of Beacon Hill and the North End make for two of the densest clusters in the city. A dog-leg pattern forms along Commonwealth Avenue as it diverges from Brighton Avenue at Packard’s Corner and snakes over to Cleveland Circles, effectively bridging the turf between Boston University and Boston College.
So how does it compare to last year’s move-in?
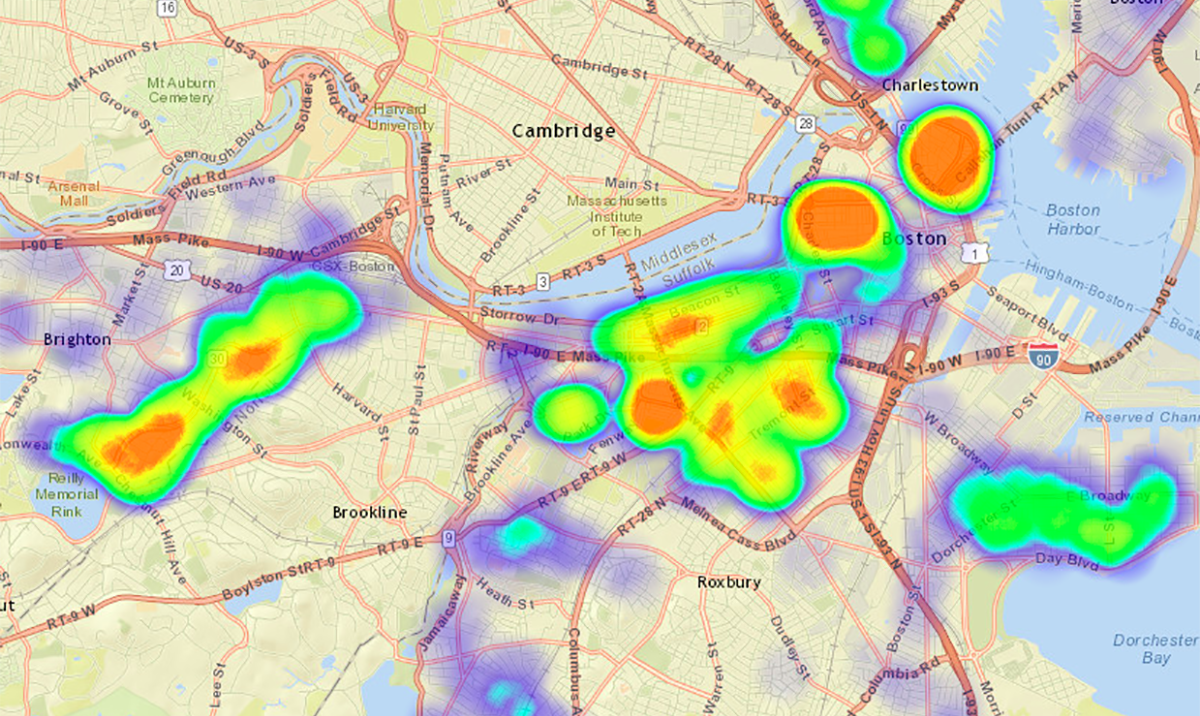

Both East Boston and South Boston have heated up since last year, with more permits issued in the latter along Carson Beach. Like an amoeba likely growing in nine-person Calumet Street apartment, the Mission Hill cluster has split into two.